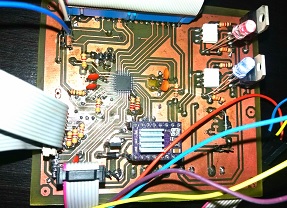
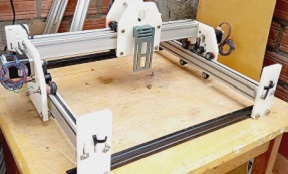
Development of custom electronic boards with CNC Router.
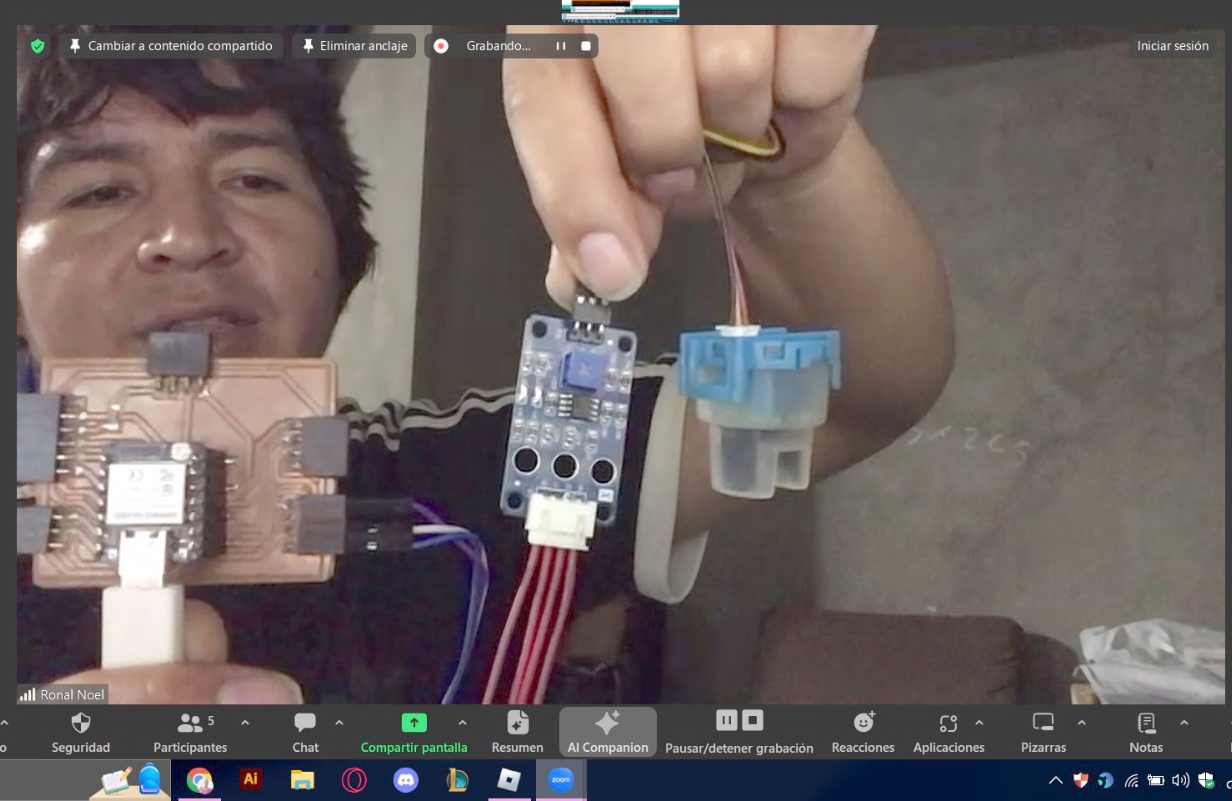
This week, we carried out group work in which each team member used their own sensors, maintaining an online connection throughout the process. We used the Zoom platform to meet, which allowed us to discuss and carry out tests with different sensors. In my case, I focused on the turbidity sensor and we were able to work collaboratively to obtain effective results.
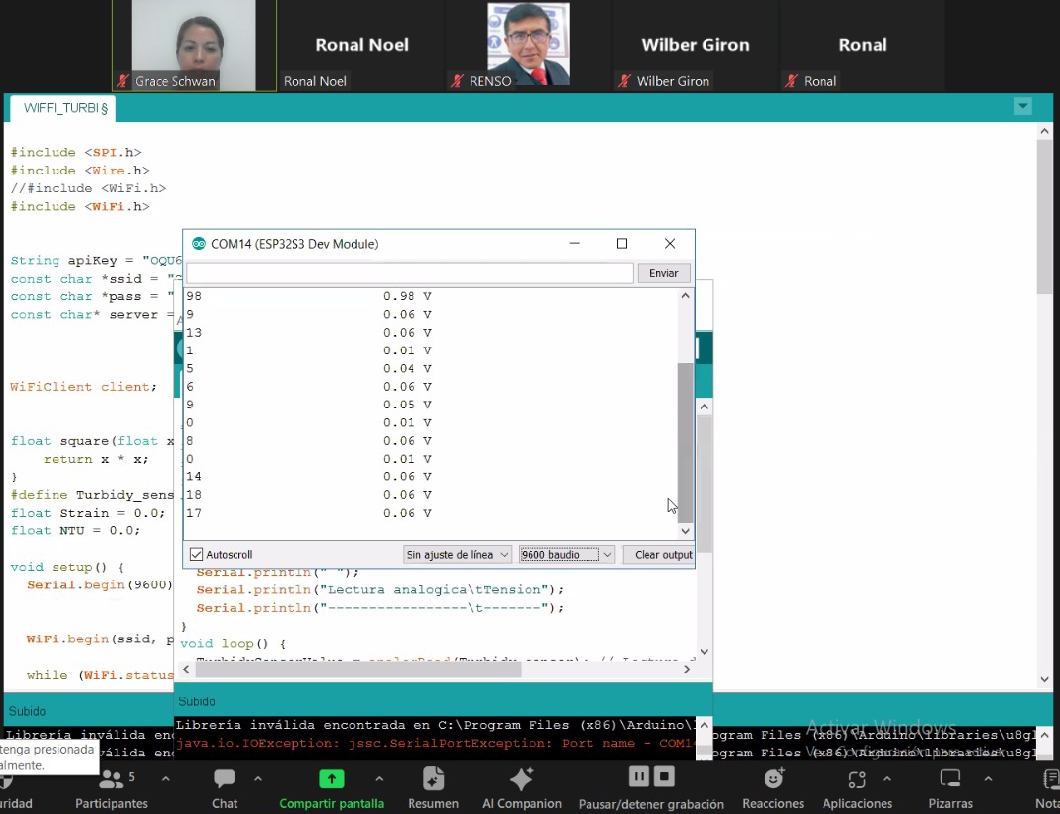
To analyze this data, we performed the test using the Arduino IDE development environment and the following code, as part of our first job.
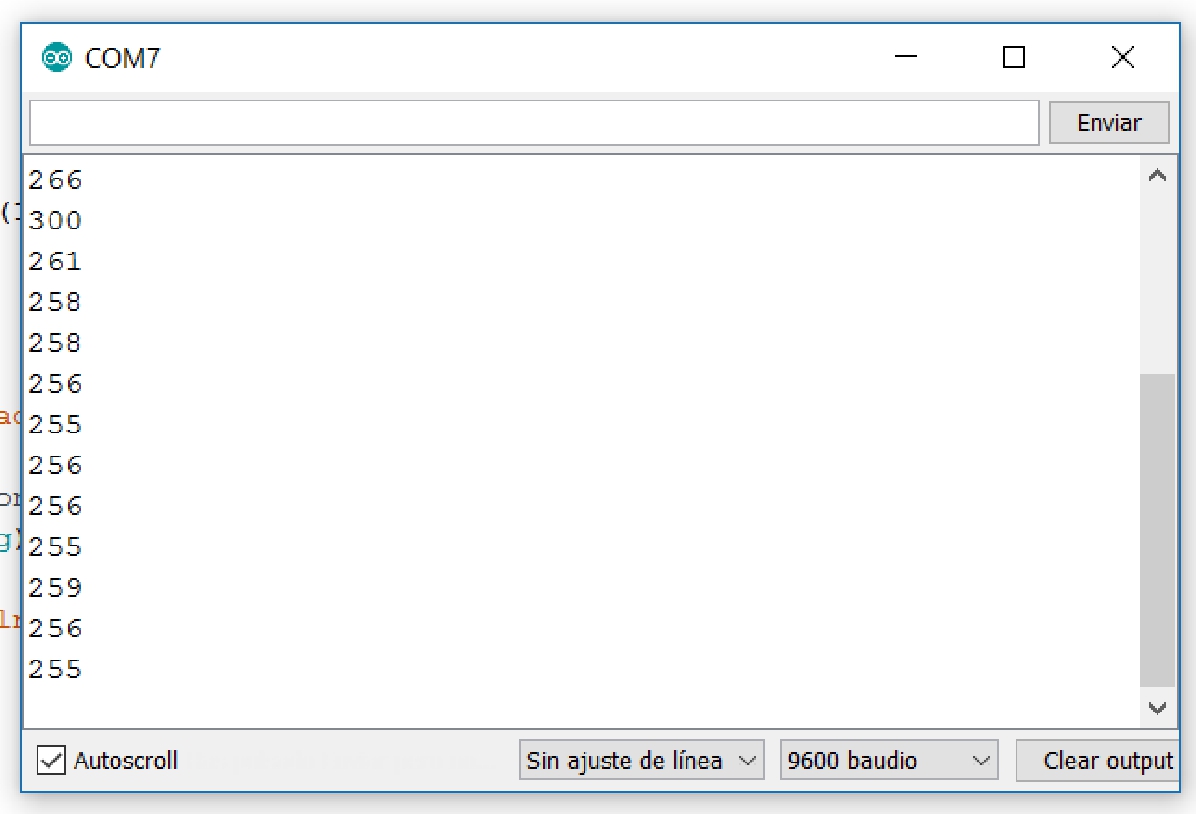
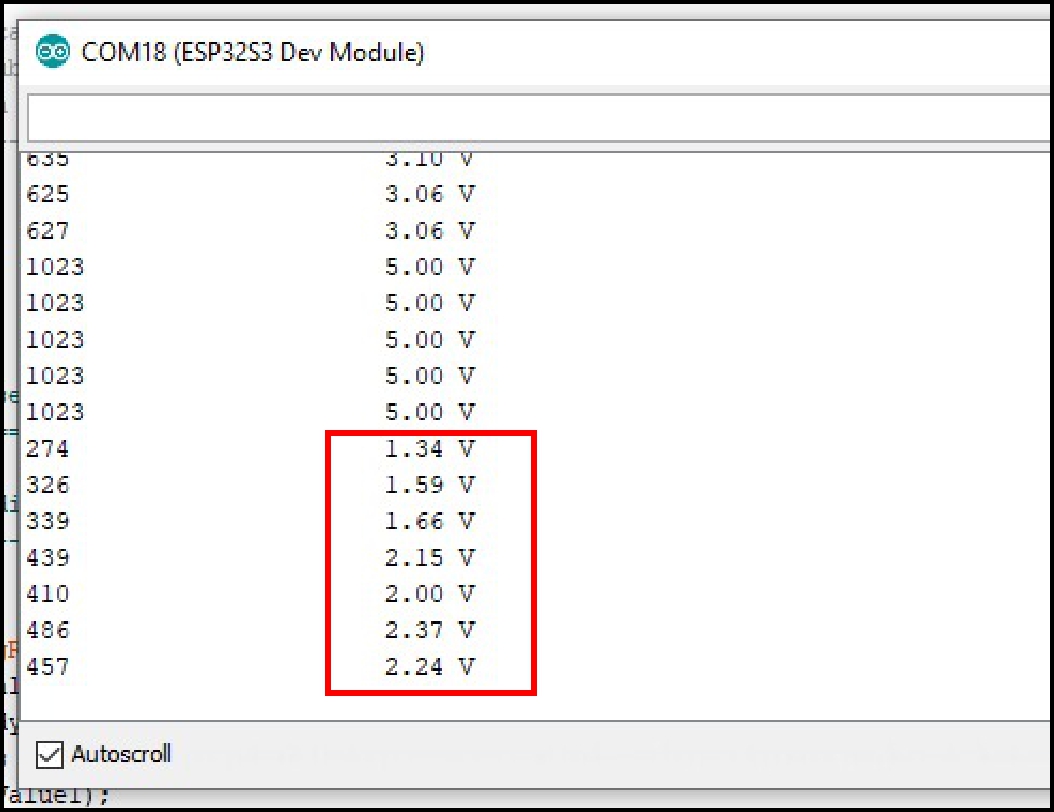
These are the results we obtained after uploading them to the XIAO, which allowed us to perform a more detailed analysis of the collected data.
An exciter or photoresistor is an electronic component whose resistance changes (normally decreases) with increasing intensity of incident light.1 It can also be called a photoconductor, photoelectric cell or light-dependent resistor, whose acronym, LDR, originates from from its English name light-dependent resistor. Its body is made up of a photoreceptor cell and two pins. The following image shows its electrical symbol.
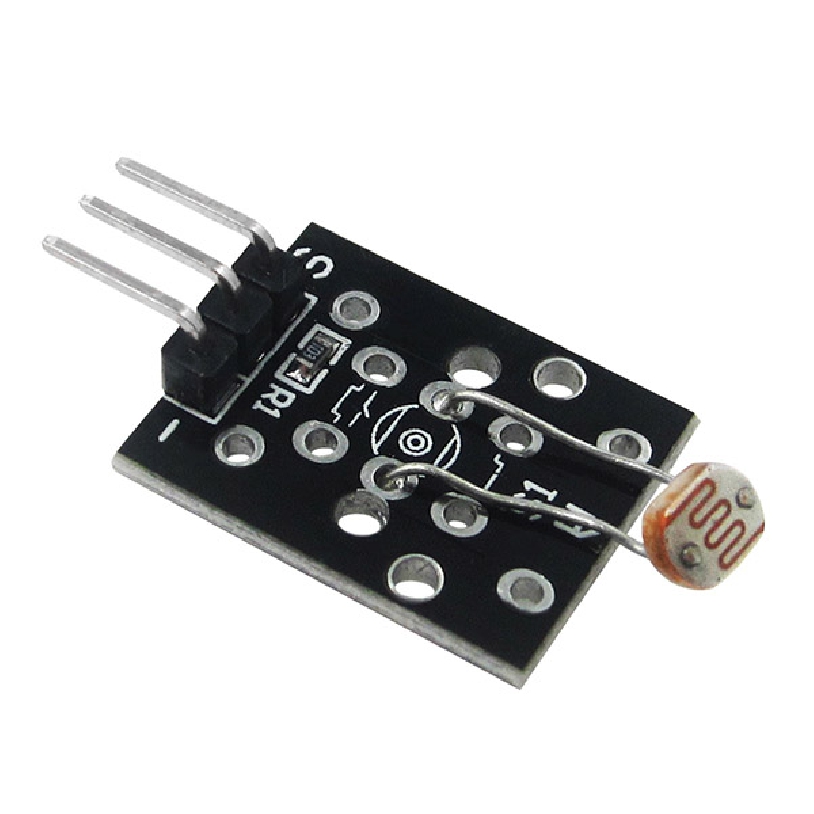
Its operation is based on the photoelectric effect. A photoresistor is made of a high-resistance semiconductor such as cadmium sulfide, CdS. If the light incident on the device is of high frequency, the photons are absorbed by the elasticities of the semiconductor giving the electrons sufficient energy to skip the driving band. The resulting free electron and its associated hole conduct electricity, thereby decreasing resistance. Typical values range from 1 MΩ or more in the dark to 100 Ω in bright light.
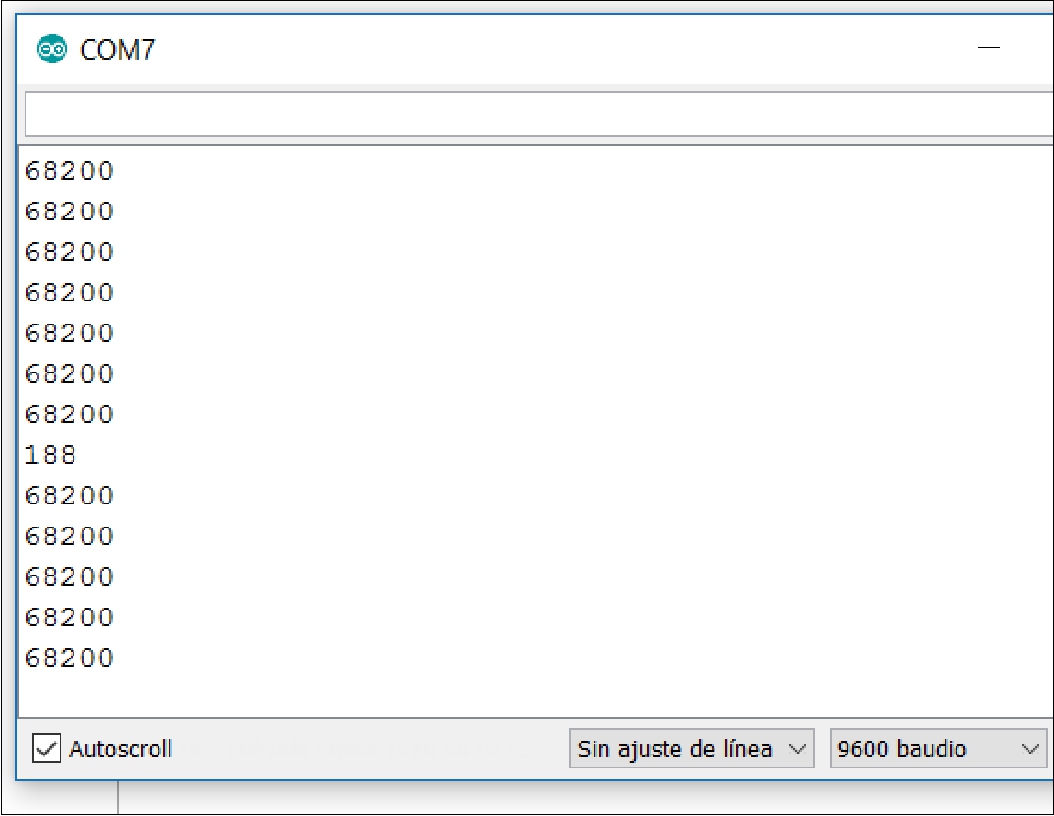
The next step involves uploading the code that interprets the sensor values, allowing us to obtain accurate readings and better understand the data collected.
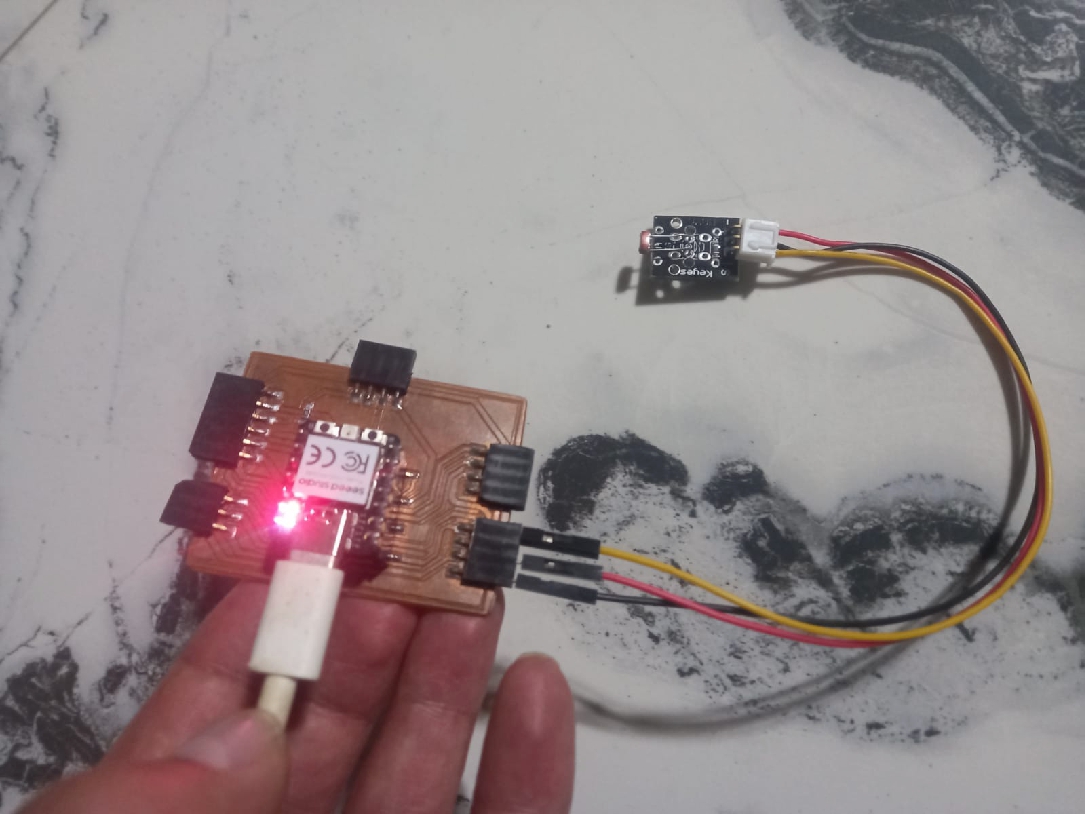
We continue reading the sensor values. As a first measure, we cover the sensor with our hand and then observe the results on the serial port.
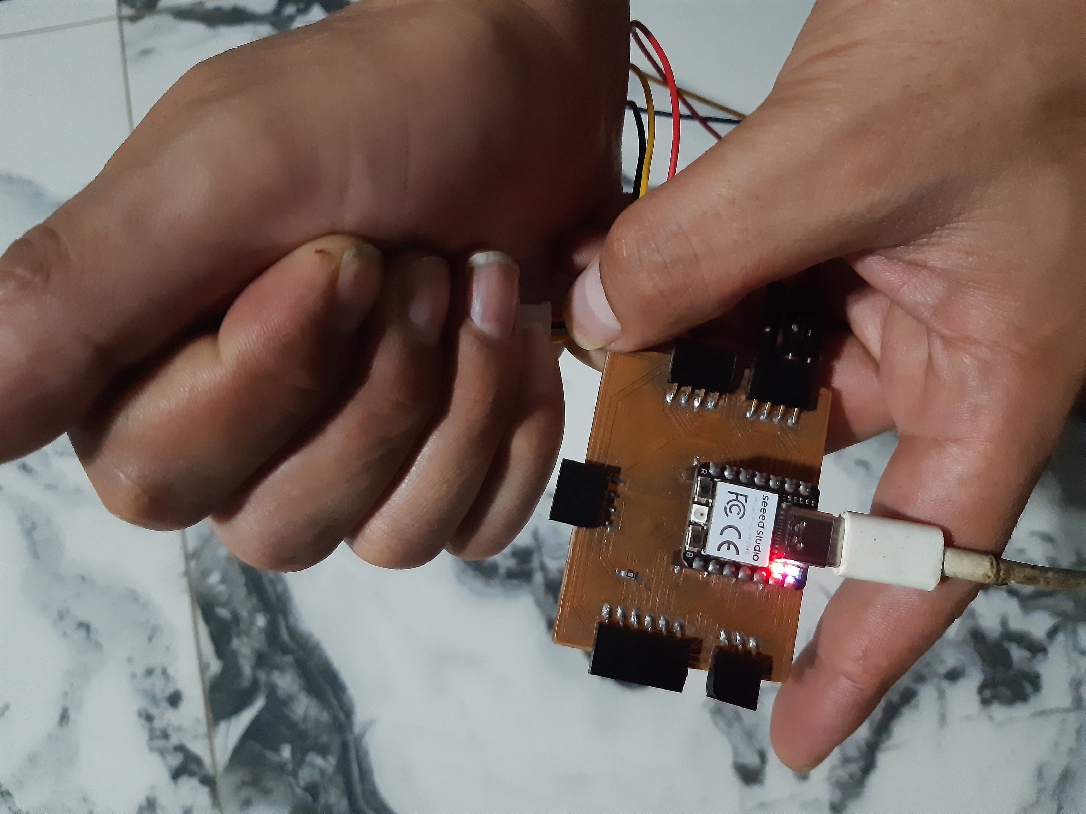
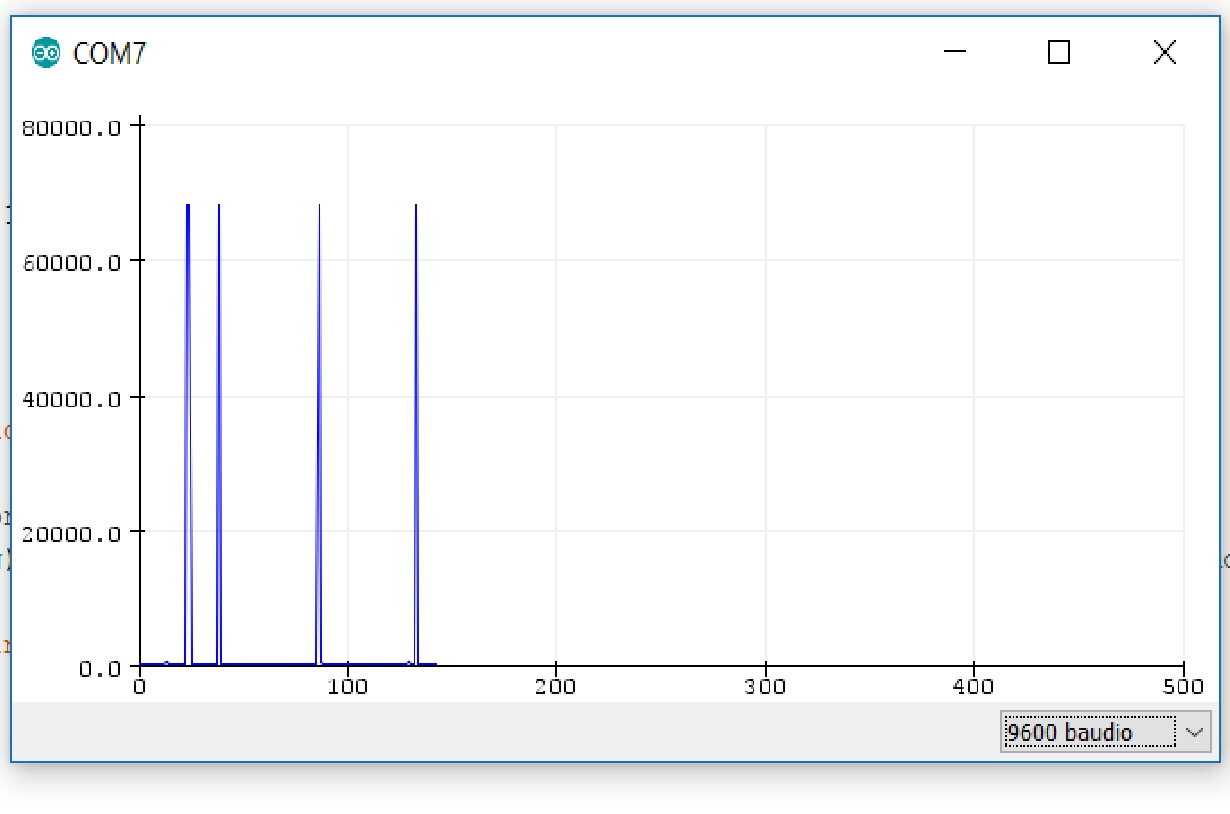
On this occasion, I provided direct illumination to the LDR sensor, which will allow you to clearly see the marked difference in the data collected.
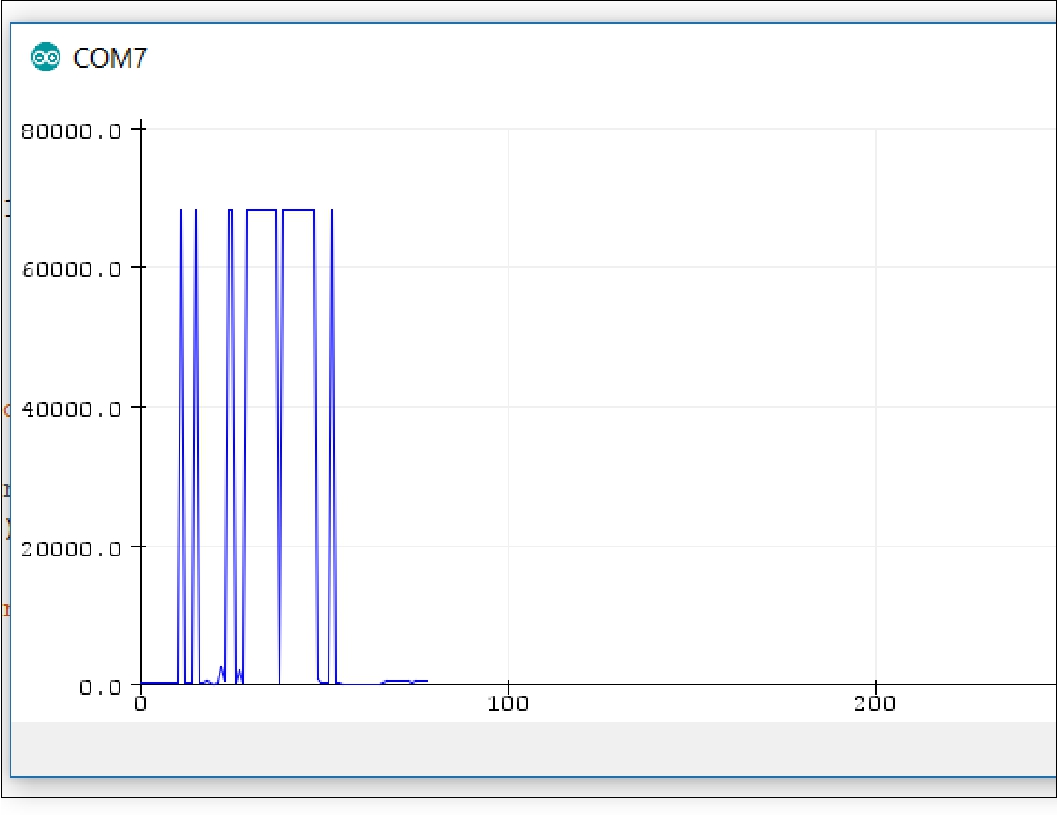
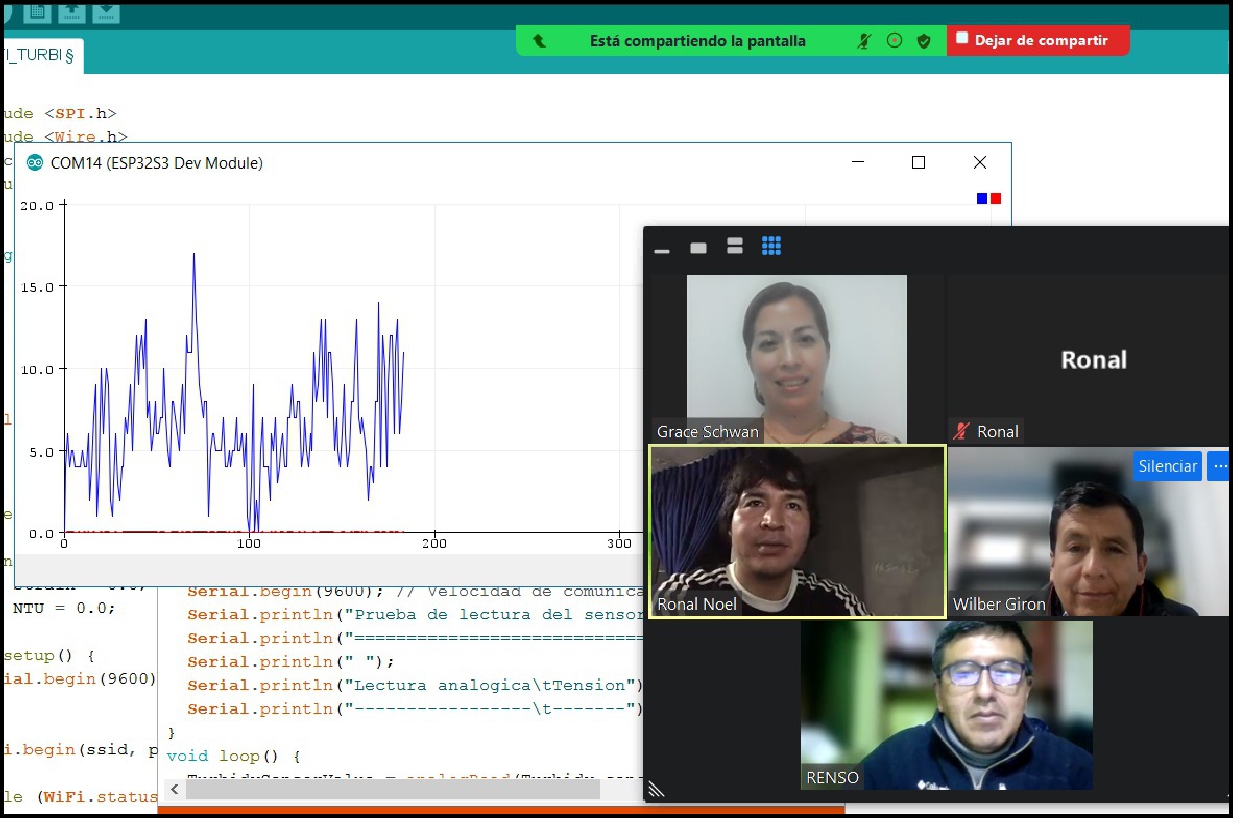
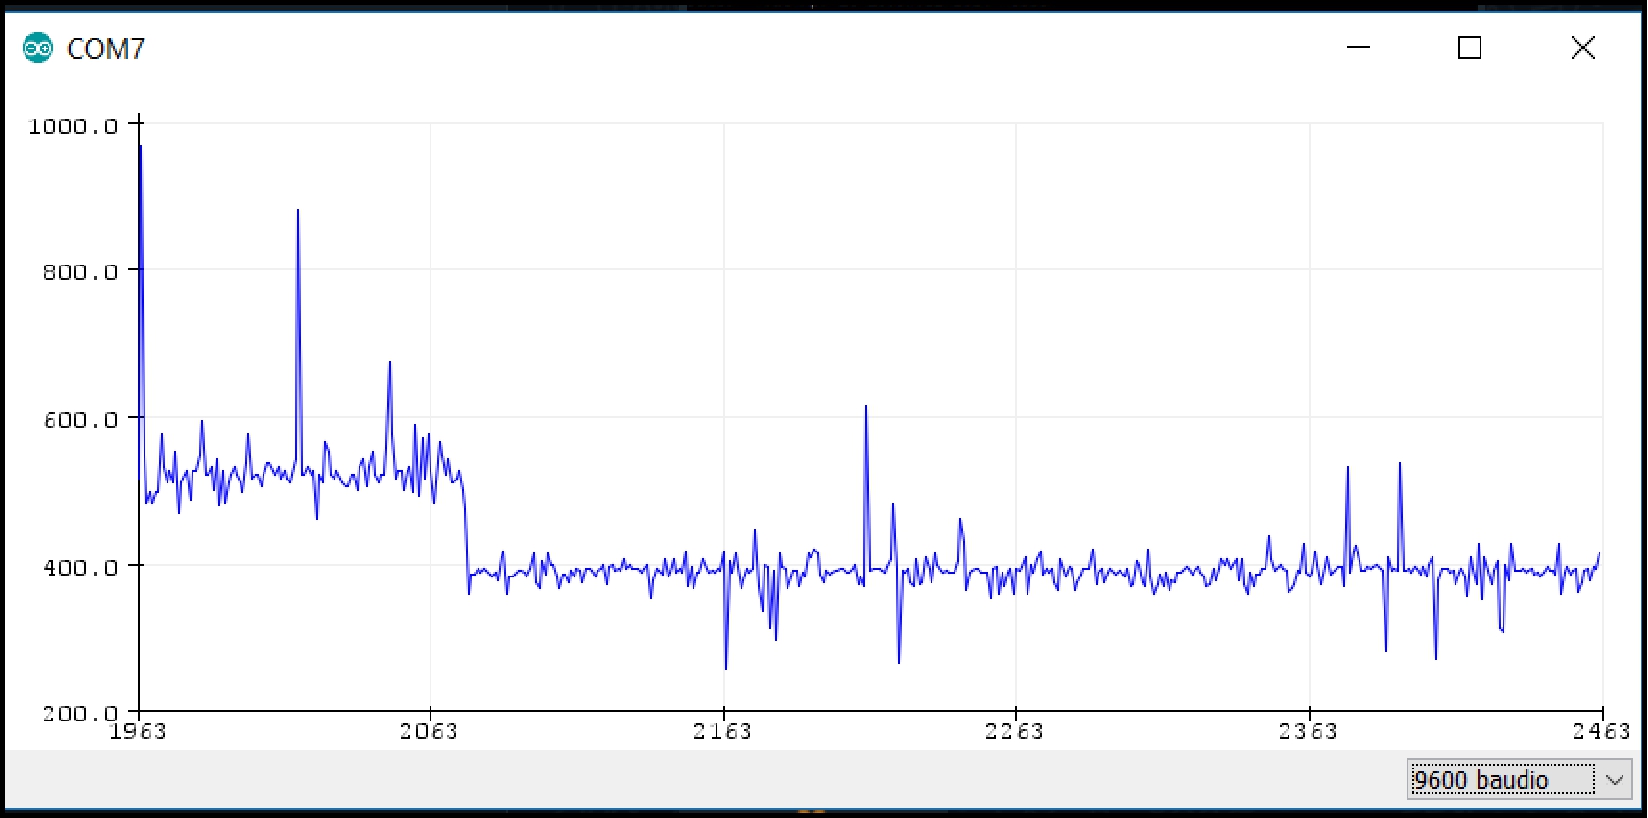
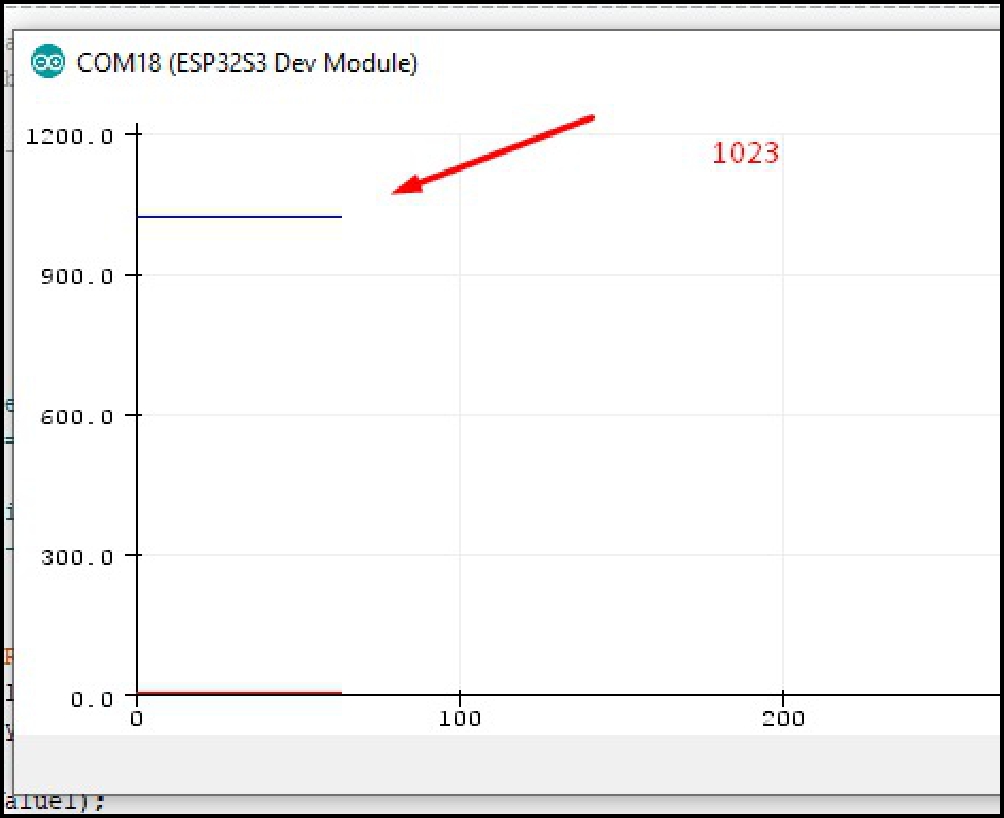
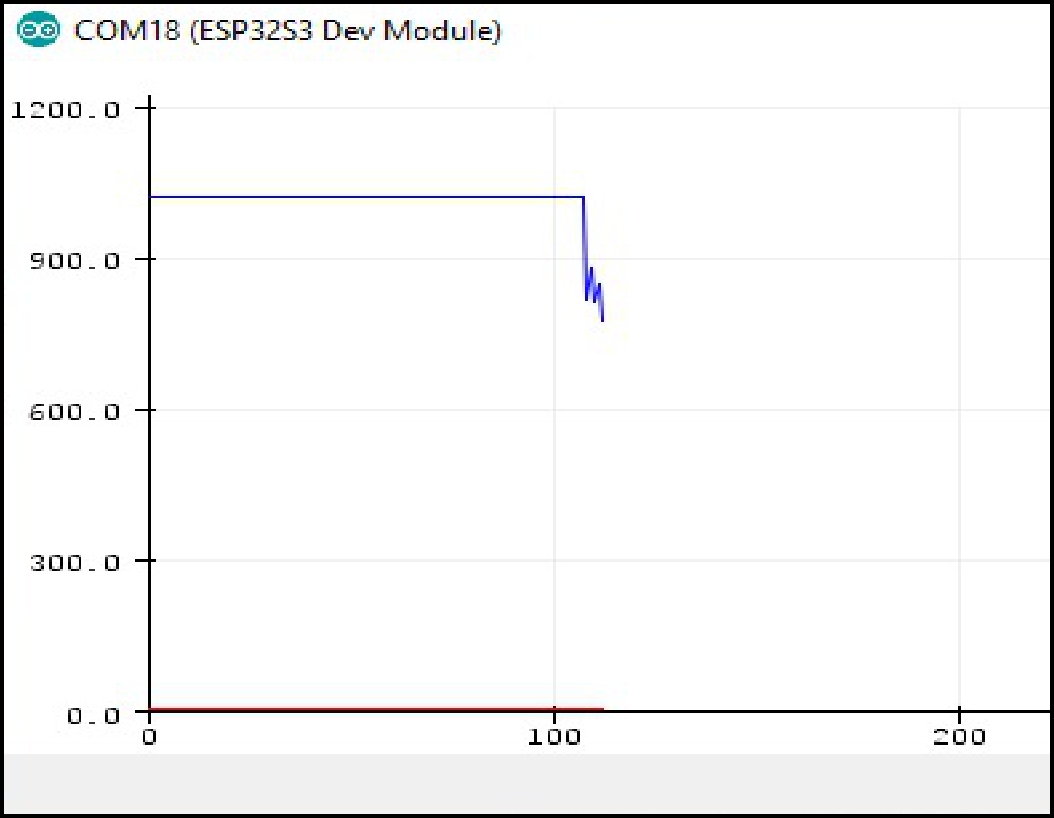
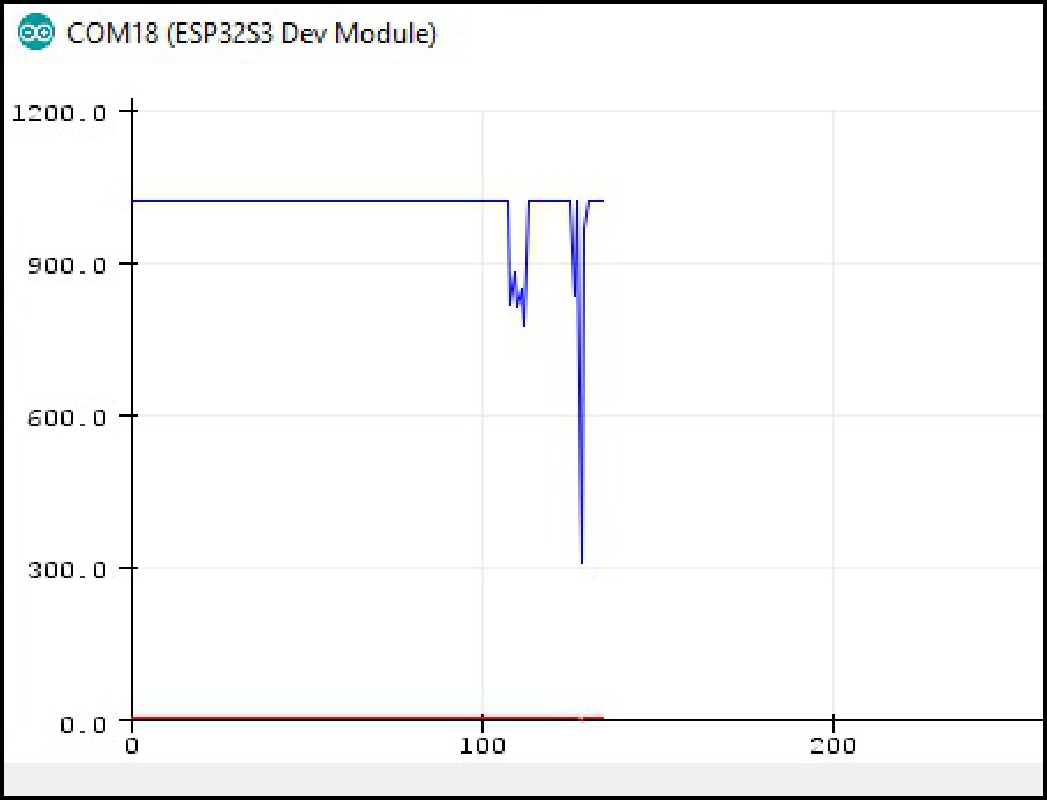
The following image shows a sequence of chart data collected by the Serial Plotter.
"It was a tremendously productive week, as as a Fablab Peru team, my colleagues Grace, Wilber, Renso and myself had the opportunity to experiment with a variety of sensors. We each shared our individual experiences, thus enriching our collective knowledge ".
| Item | Value |
|---|---|
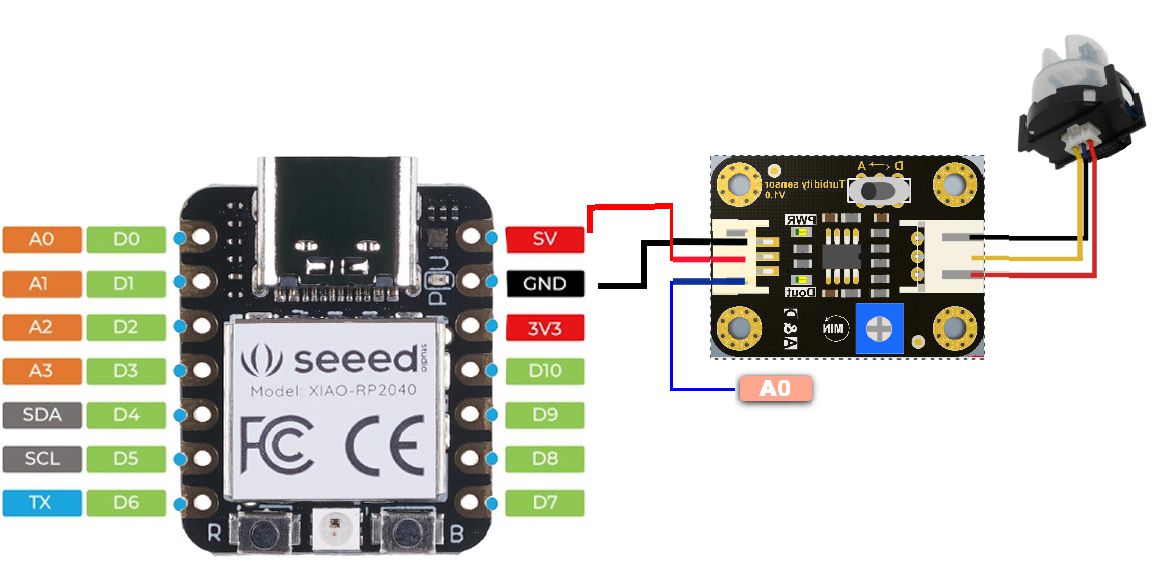
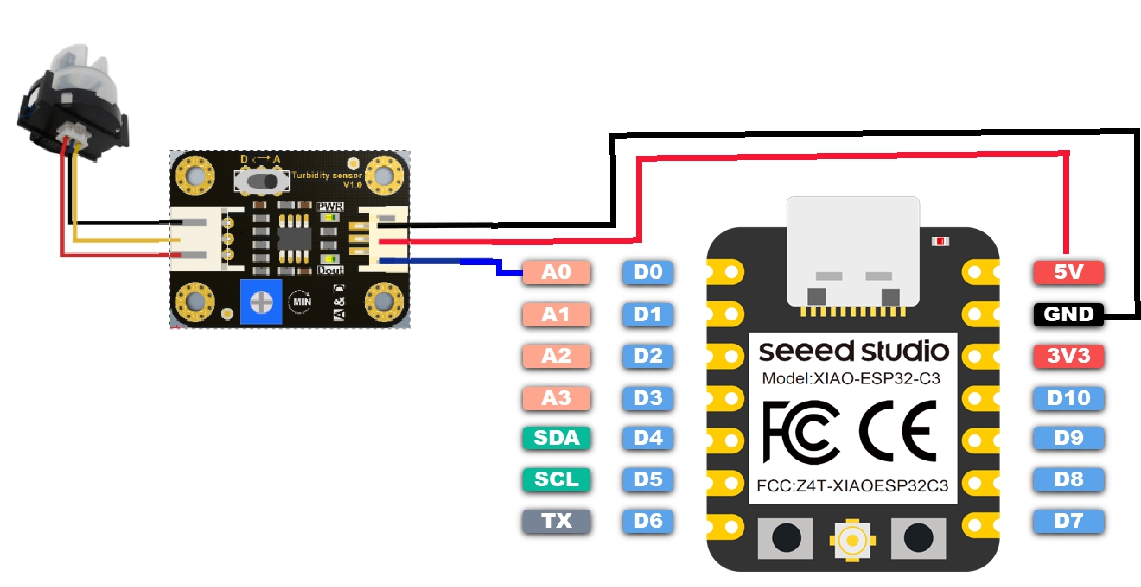
| 5V: | 5V DC XIAO / +V Sensor |
| GND: | GND XIAO/ G Sensor |
| Analogical: | A0 XIAO/ A-OUT Sensor |
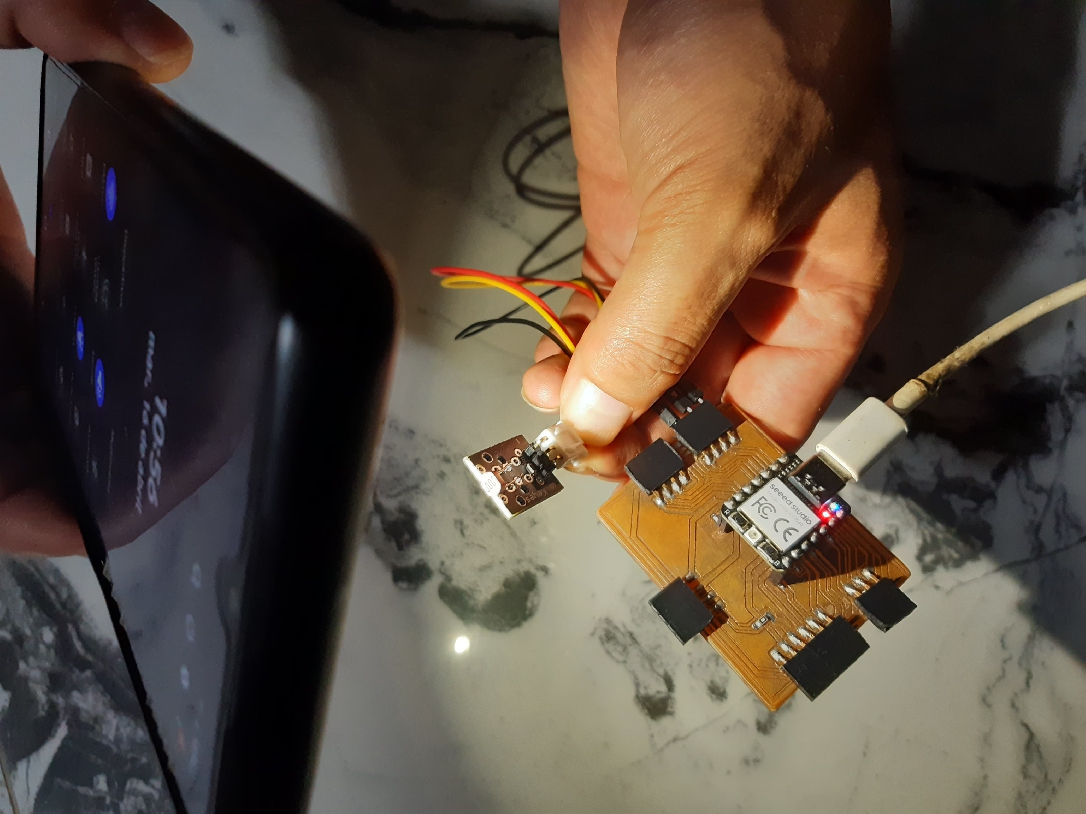
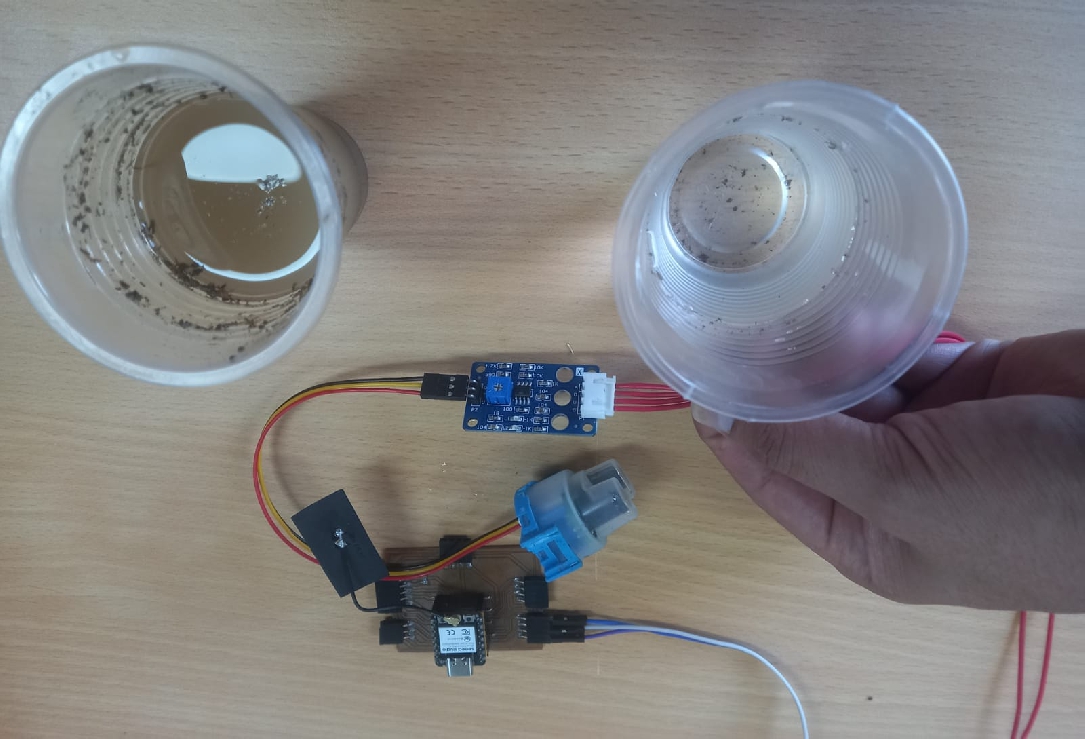
The connection circuit between the XIAO RP2024 and the water turbidity sensor is as follows:
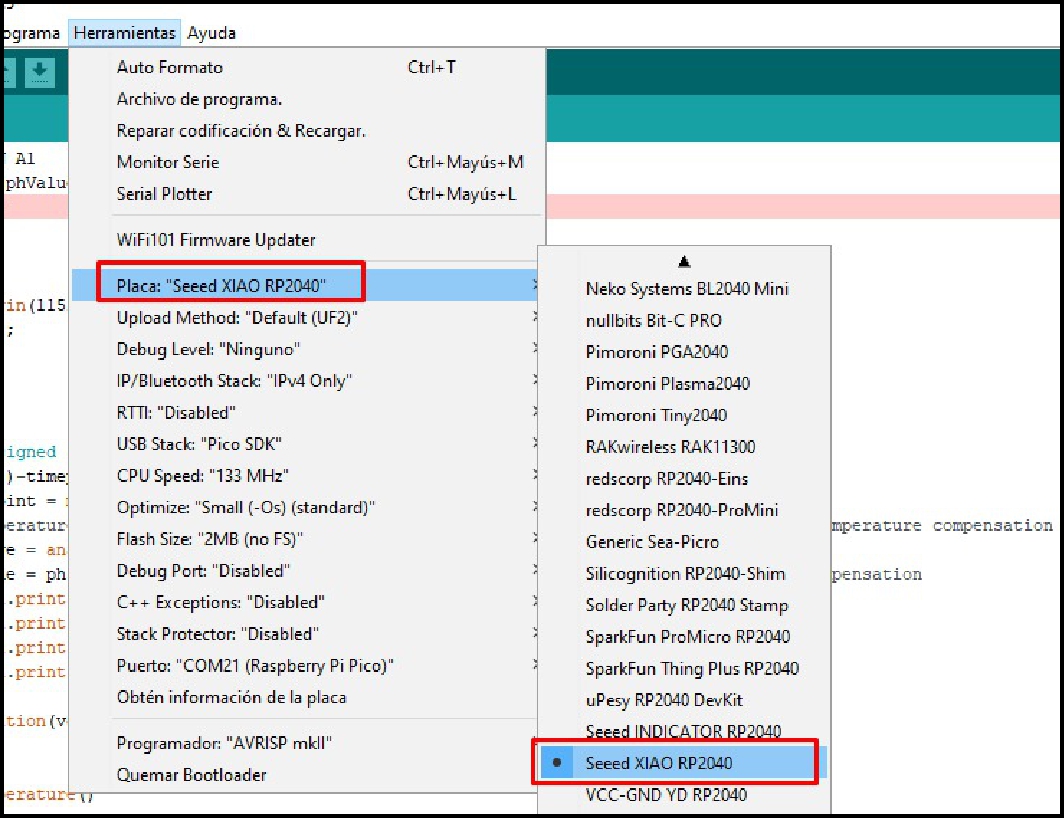
Having already installed the XIAO RP2040 board, go to Tools -> Board, search for "Seeed Studio XIAO RP2040" and select it. With this, we will have completed the configuration of the Seeed Studio XIAO RP2040 for the Arduino IDE. Then we select the serial position.
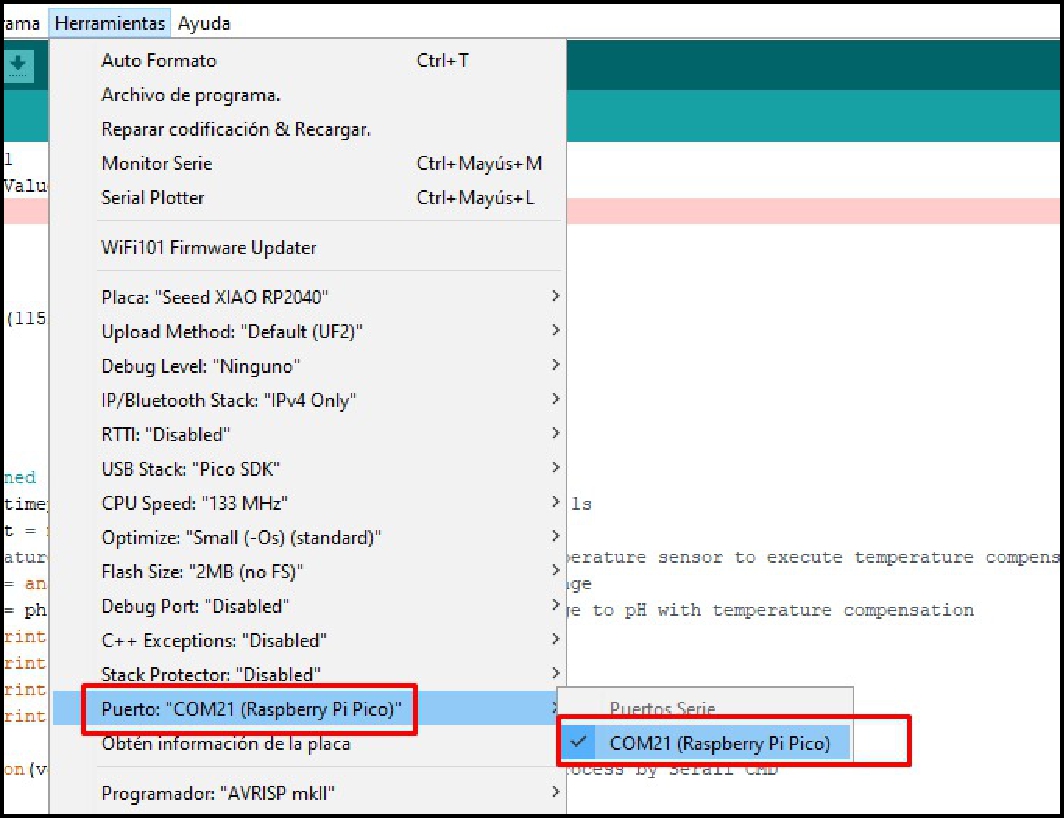
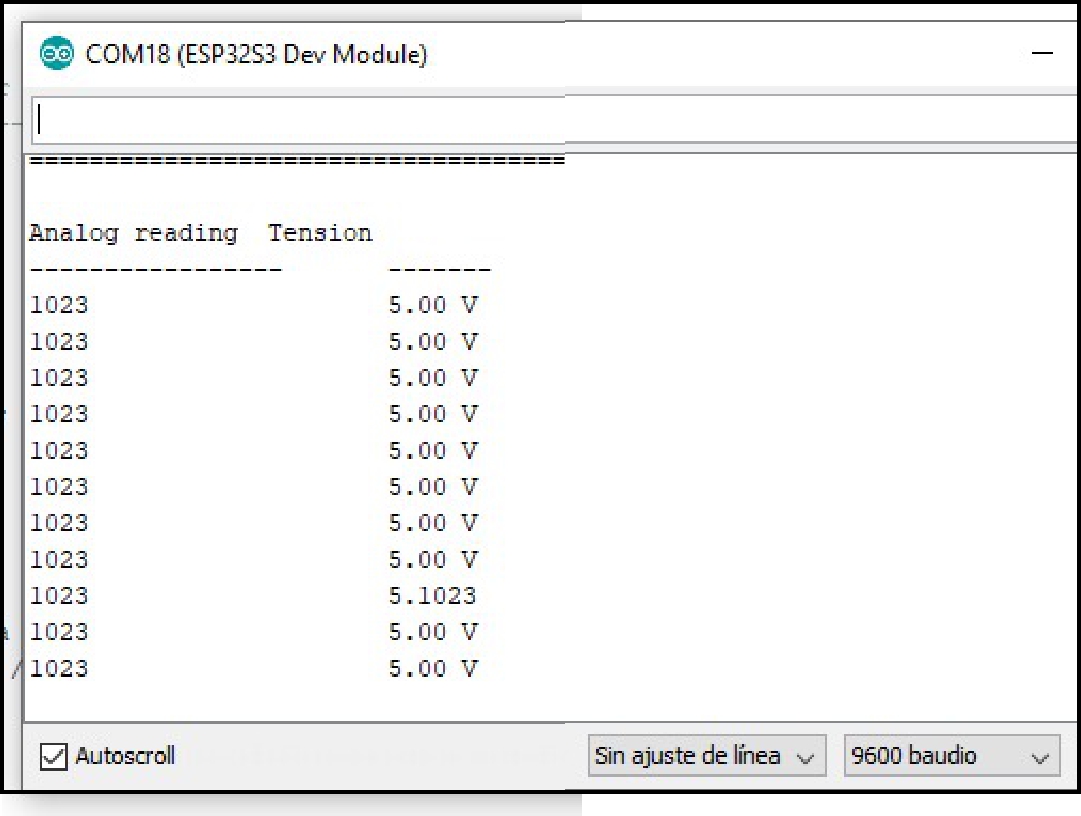
Connect the water turbidity sensor to Pin A0 as an analog input signal. Next, load the following code to be able to view the values in real time.
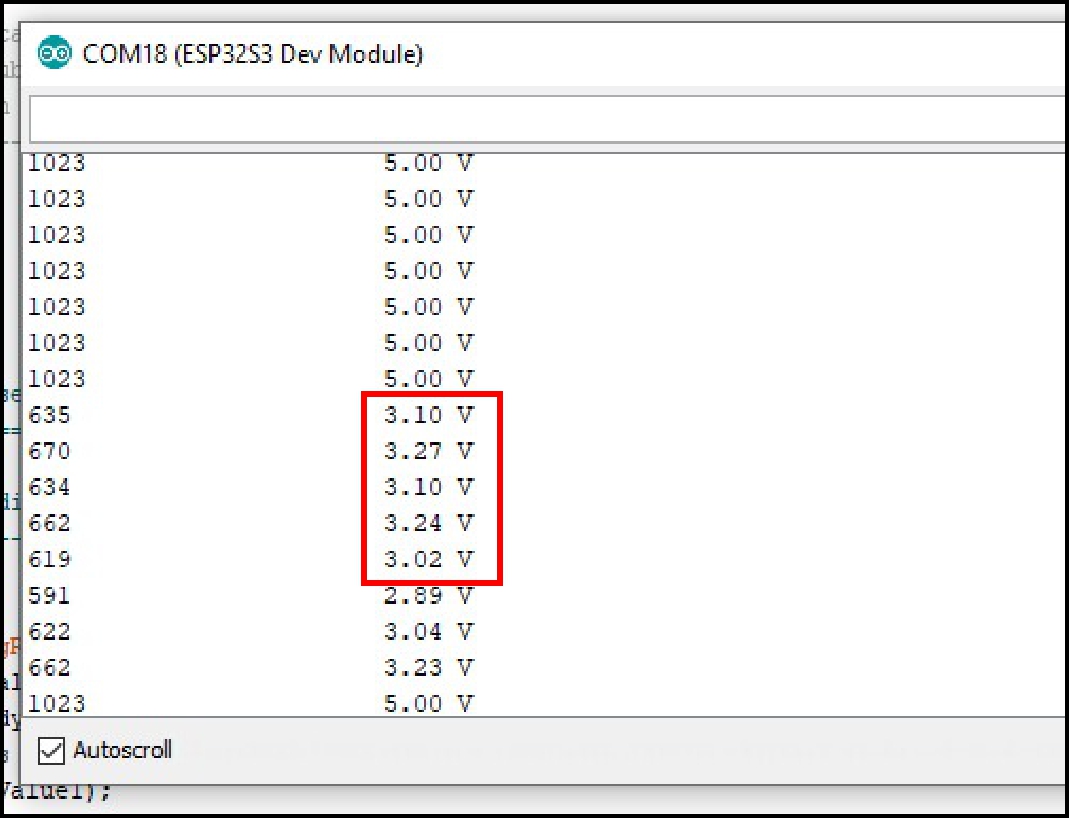
According to the data obtained, clean water shows 5V and values of 1023, which is equivalent to 10 bits.
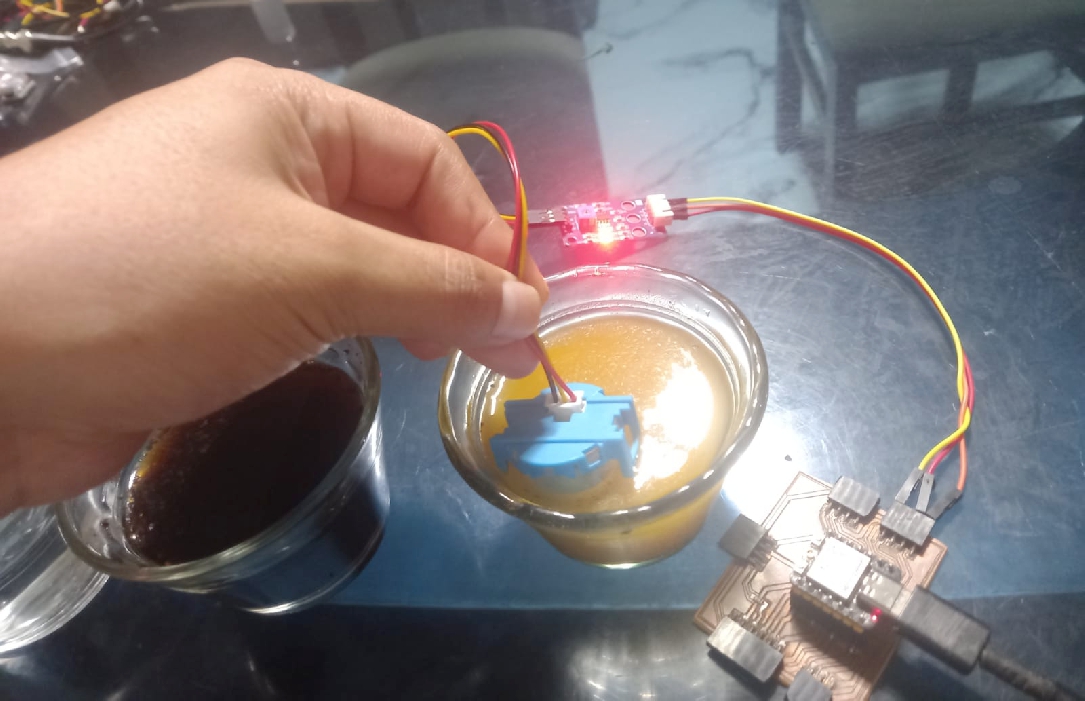
Now for the next case of yellow soil dissolved in water. As shown below, the voltage values have changed, being approximately 3V in this case. Additionally, you can observe the drop in the graph on the plotter serial communicator
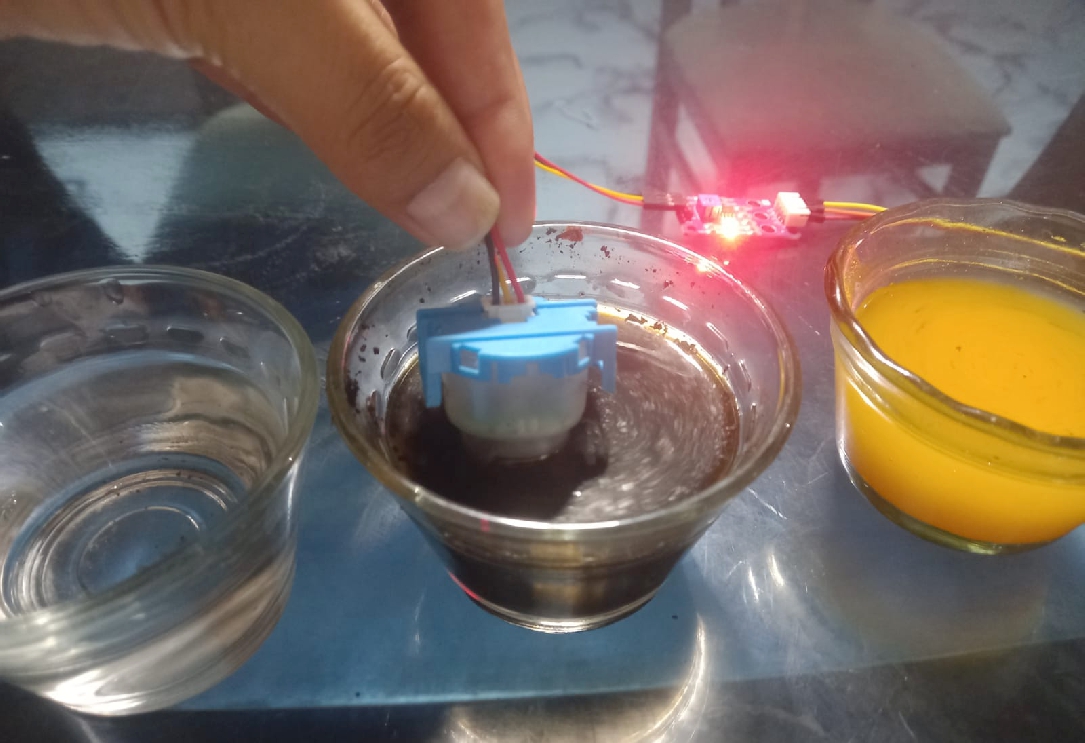
In this third case, it is observed that the turbidity of the water has increased considerably, since the voltage has decreased to approximately 1V. Likewise, it is observed in the plotter serial communication that it drops significantly.
The turbidity unit was defined “as the optical obstruction of light, caused by one million silica in distilled water.” There are different units to express turbidity: NTU, FNU, FAU and JTU.
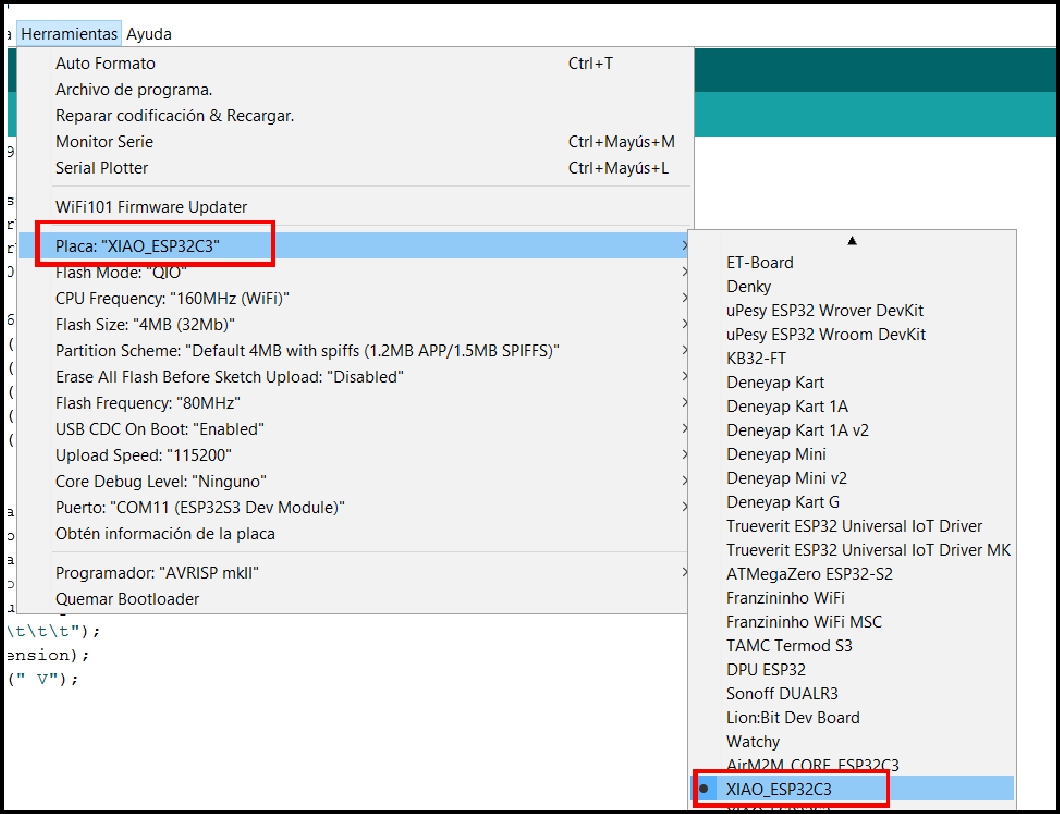
To carry out this example, I chose to use the XIAO ESP32-C3 due to the need for a Wi-Fi connection to be able to view real-time data on the state of water turbidity. This data is hosted on a free web server at ThingSpeak. This example is complementary to my final project and contributes significantly to its functionality.
| Item | Value |
|---|---|
| 5V: | 5V DC XIAO / +V Sensor |
| GND: | GND XIAO/ G Sensor |
| Analogical: | A0 XIAO/ A-OUT Sensor |
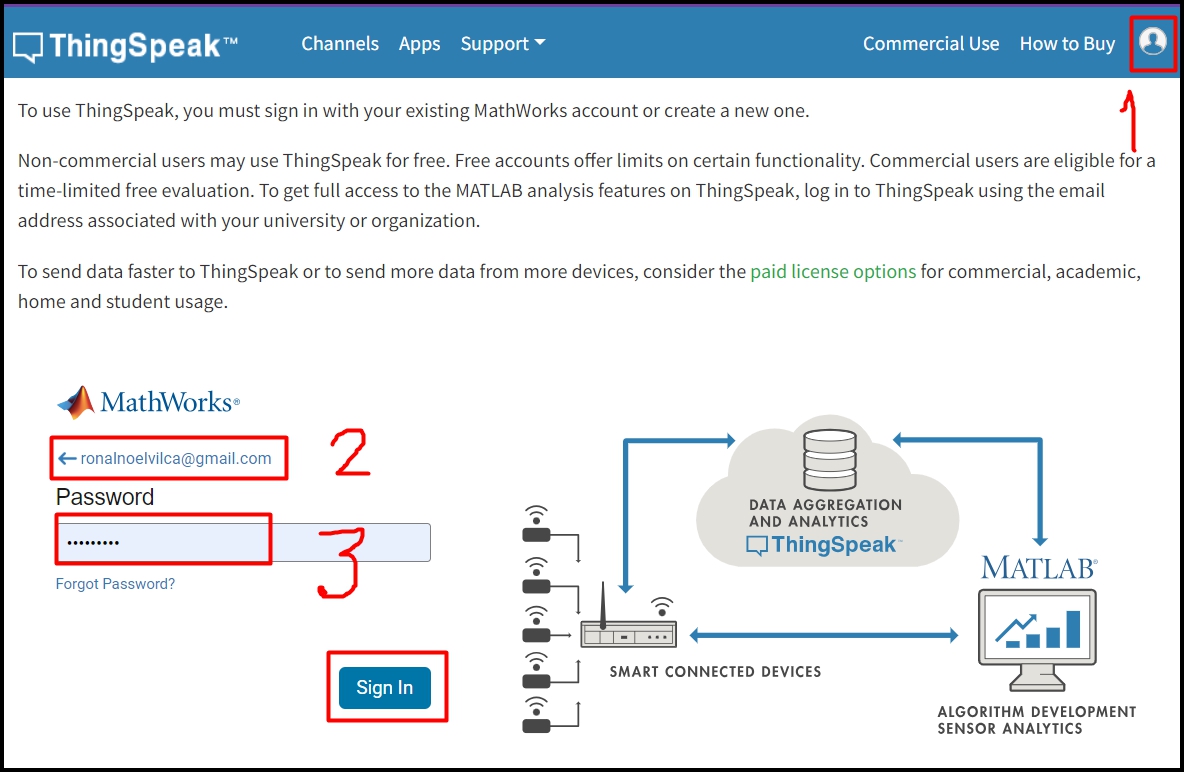
The steps are simple; You only need an email, in my case, my personal email, to be able to use ThingSpeak.
The next step is to log in and create an account, as shown in the image.
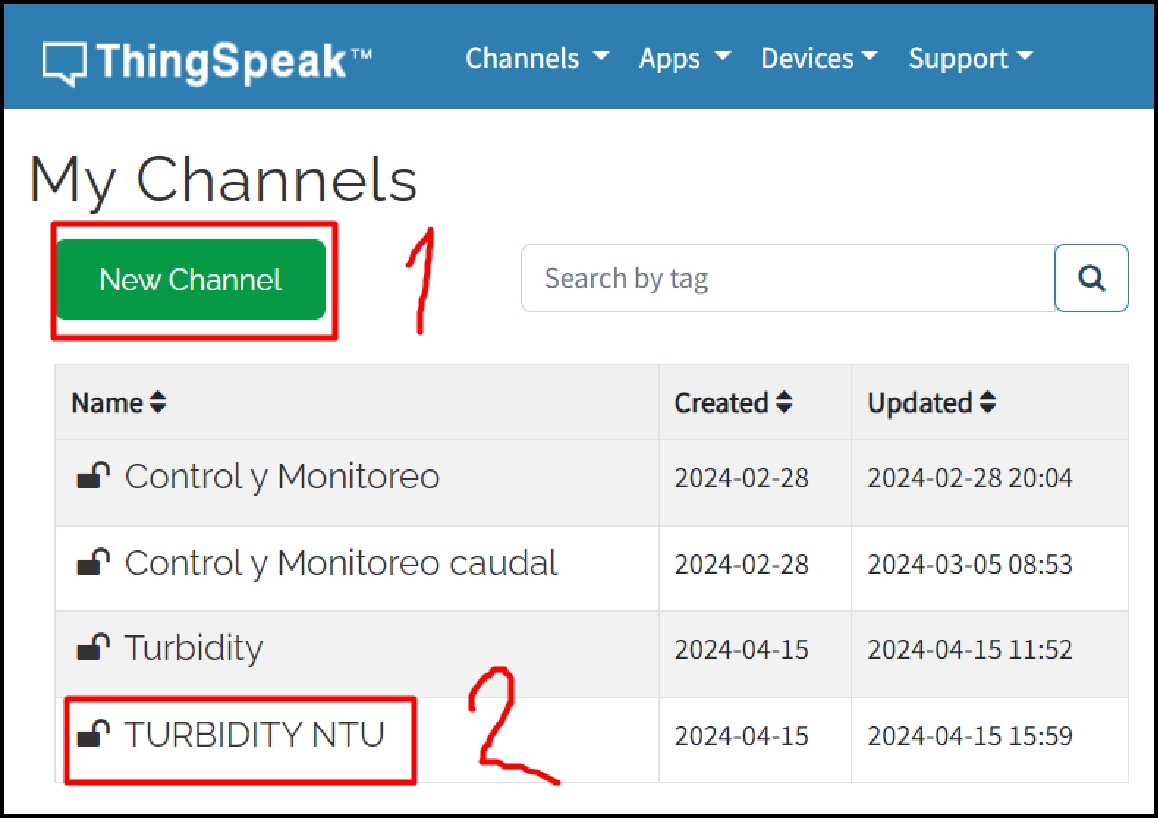
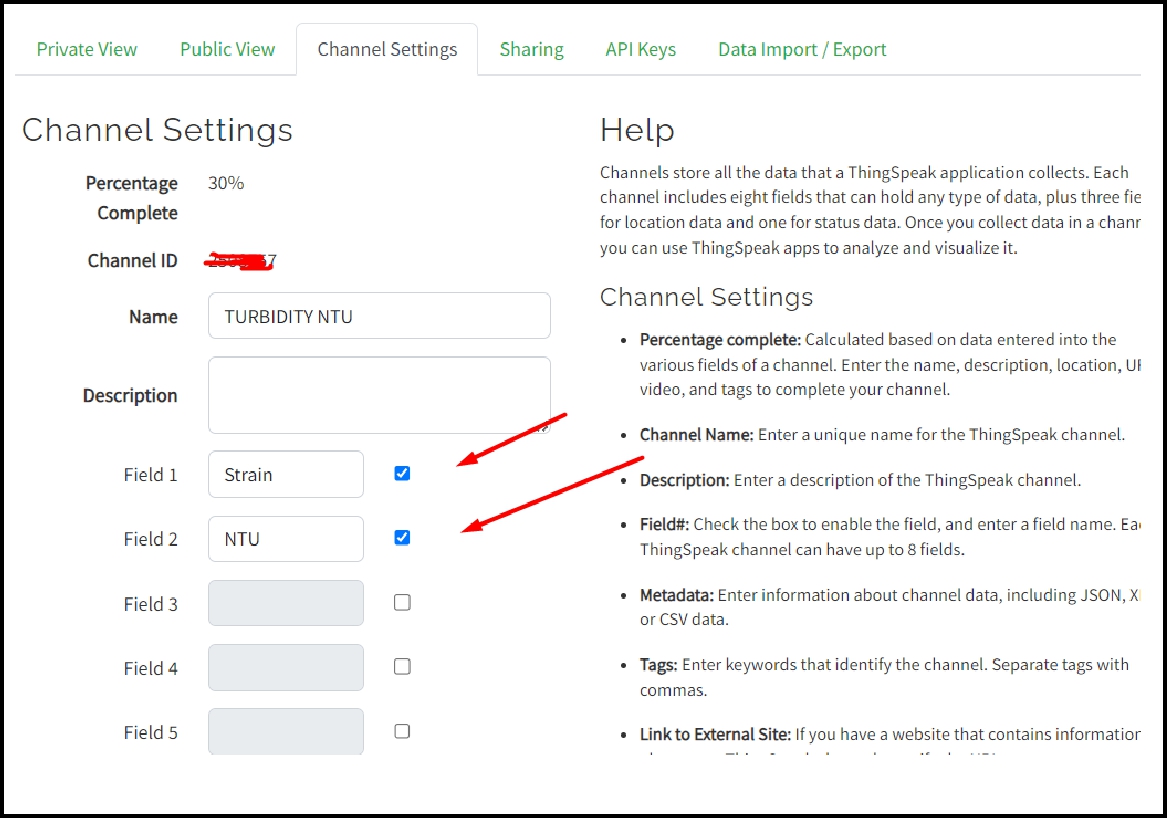
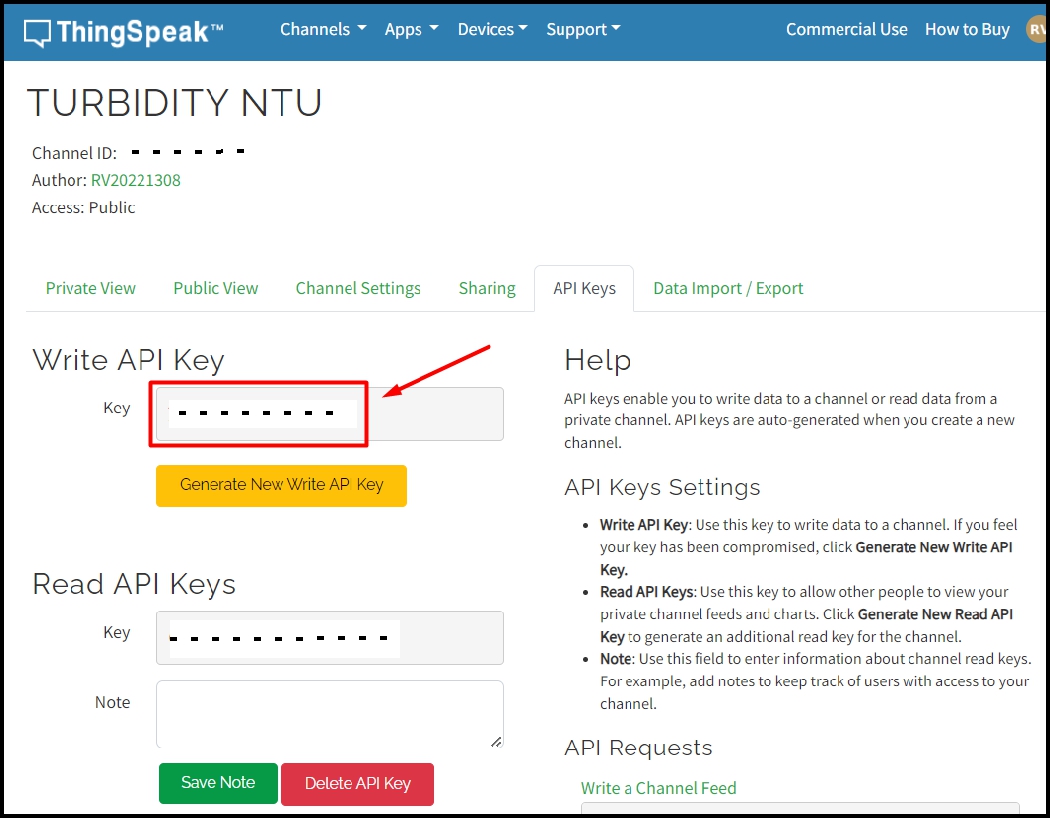
After creating your account, the next step is to configure it and take note of the API Key.
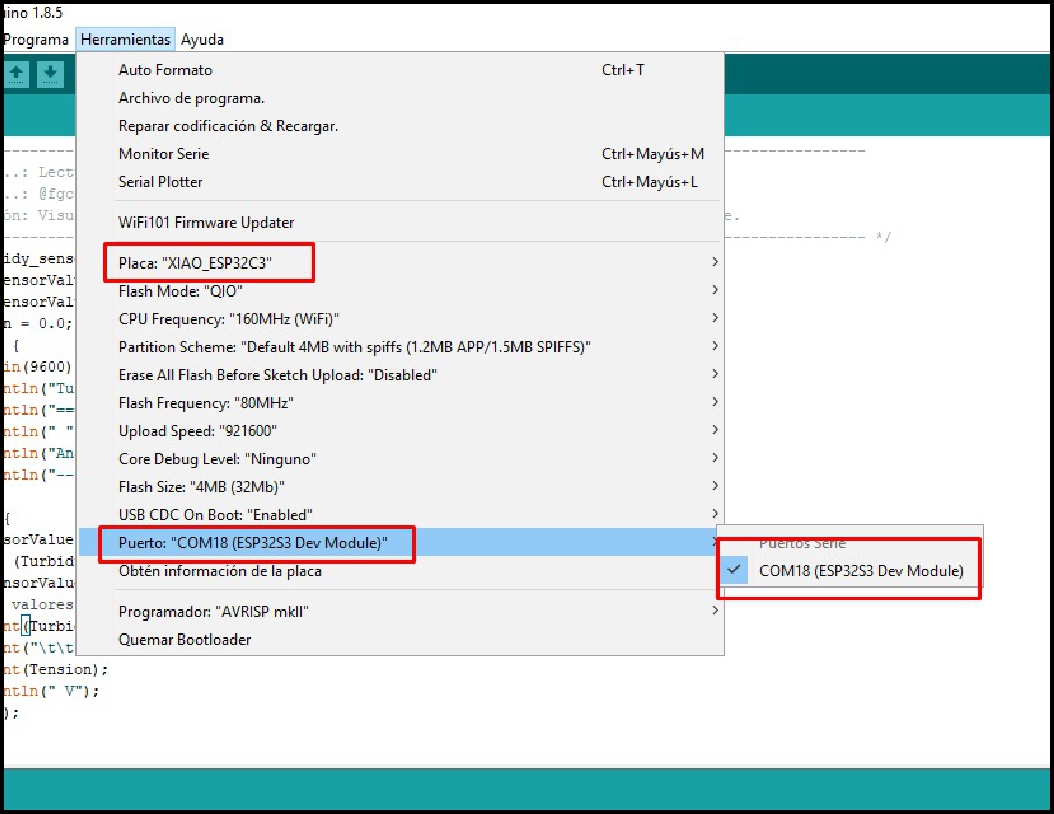
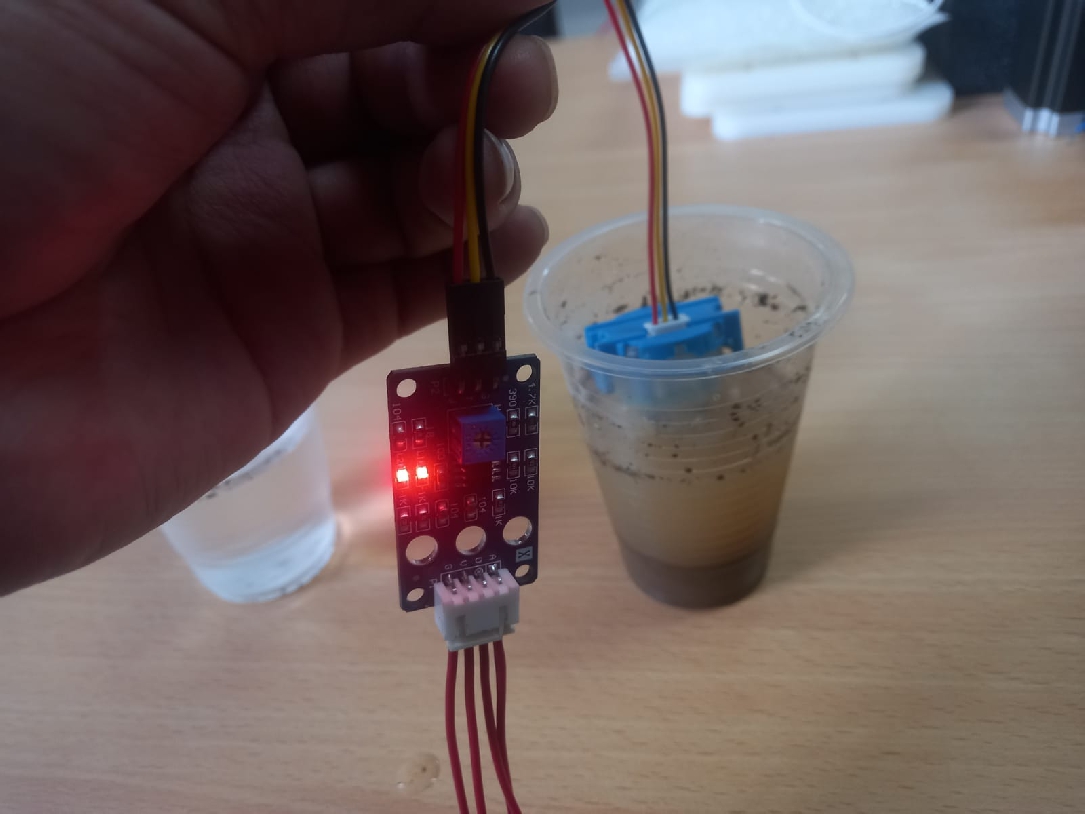
To illustrate reading over Wi-Fi, I relied on the XIAO ESP32-C3 along with a turbidity sensor, as well as the board I presented in previous weeks. We start by selecting the board and the COM port that we will use.
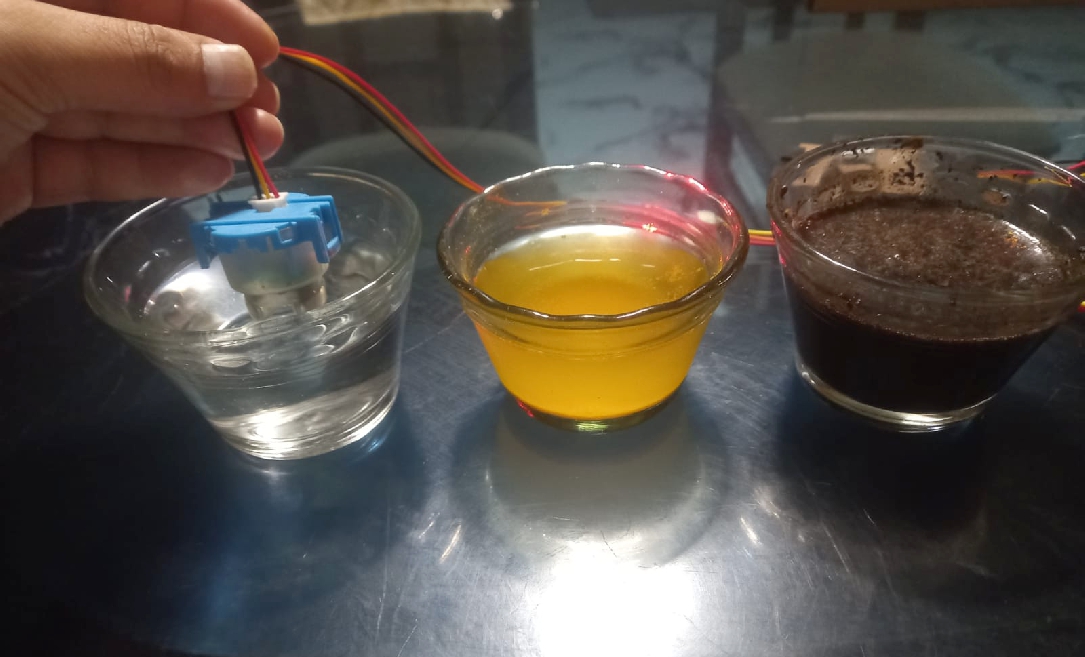
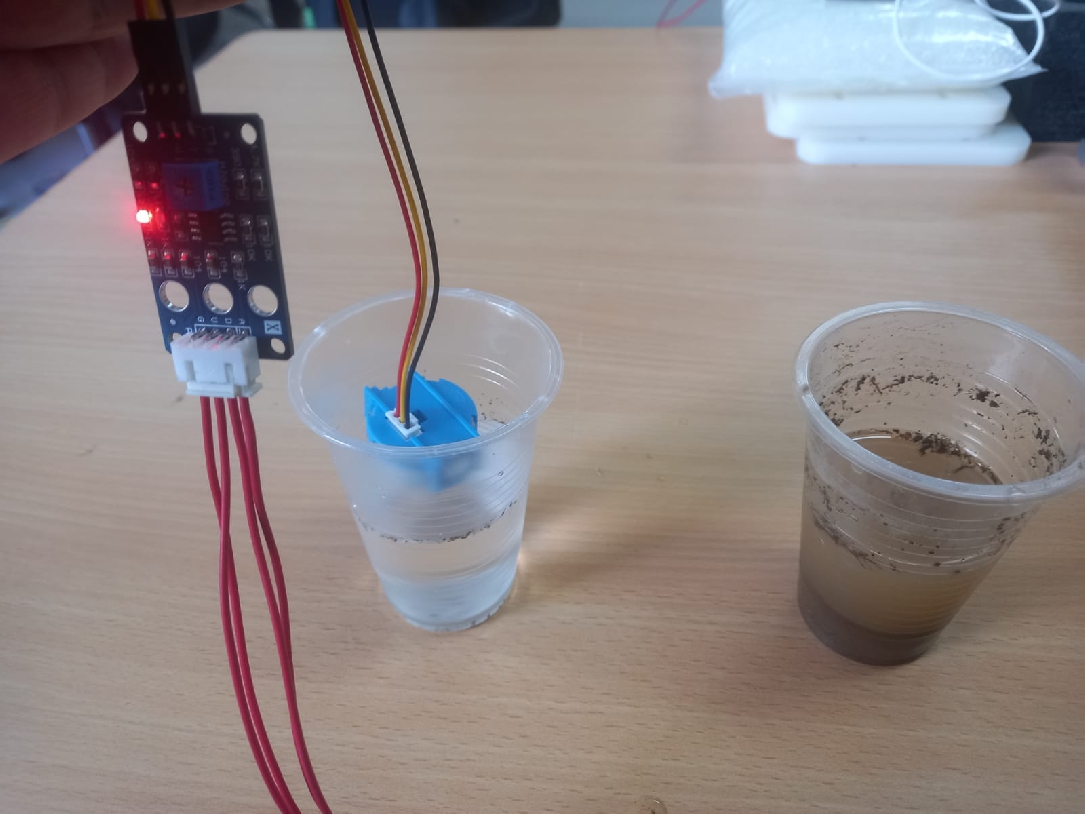
For this practical exercise, I selected two containers: one containing clear water and one containing cloudy water, in order to illustrate the differences in the reading process.
With this experiment, we can observe the data that is generated in the cloud and view it in the control panel
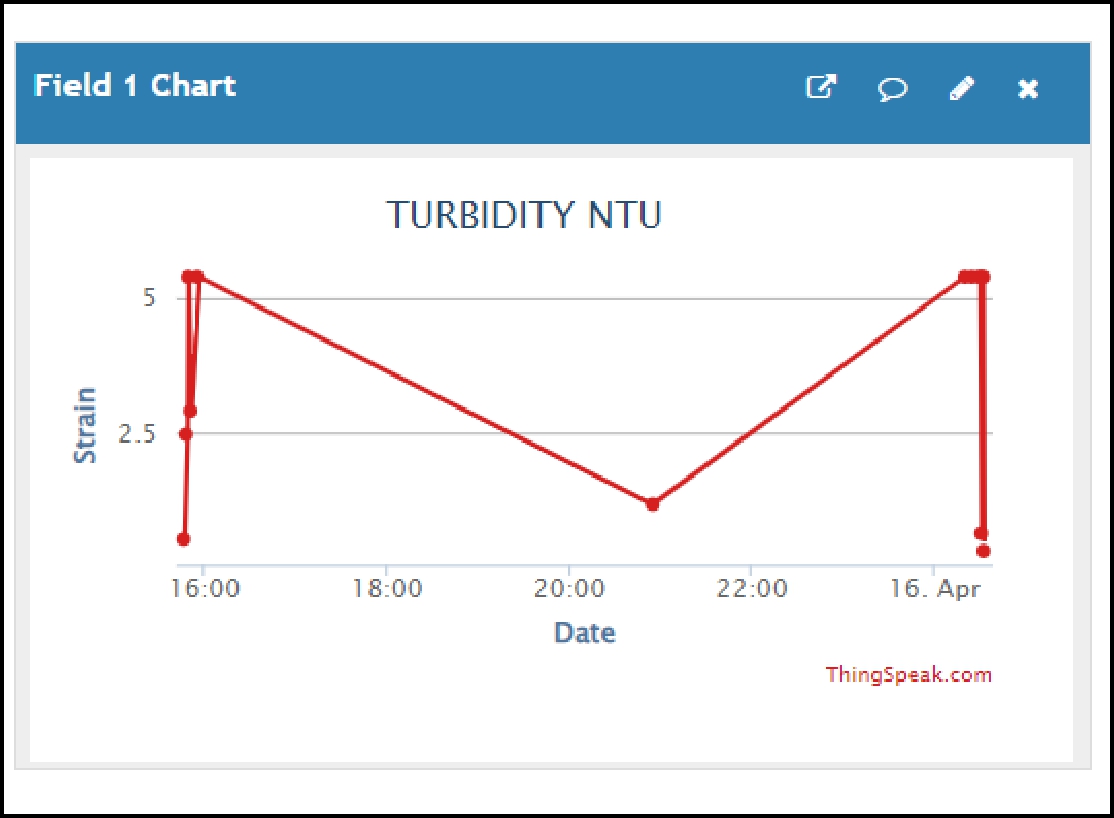
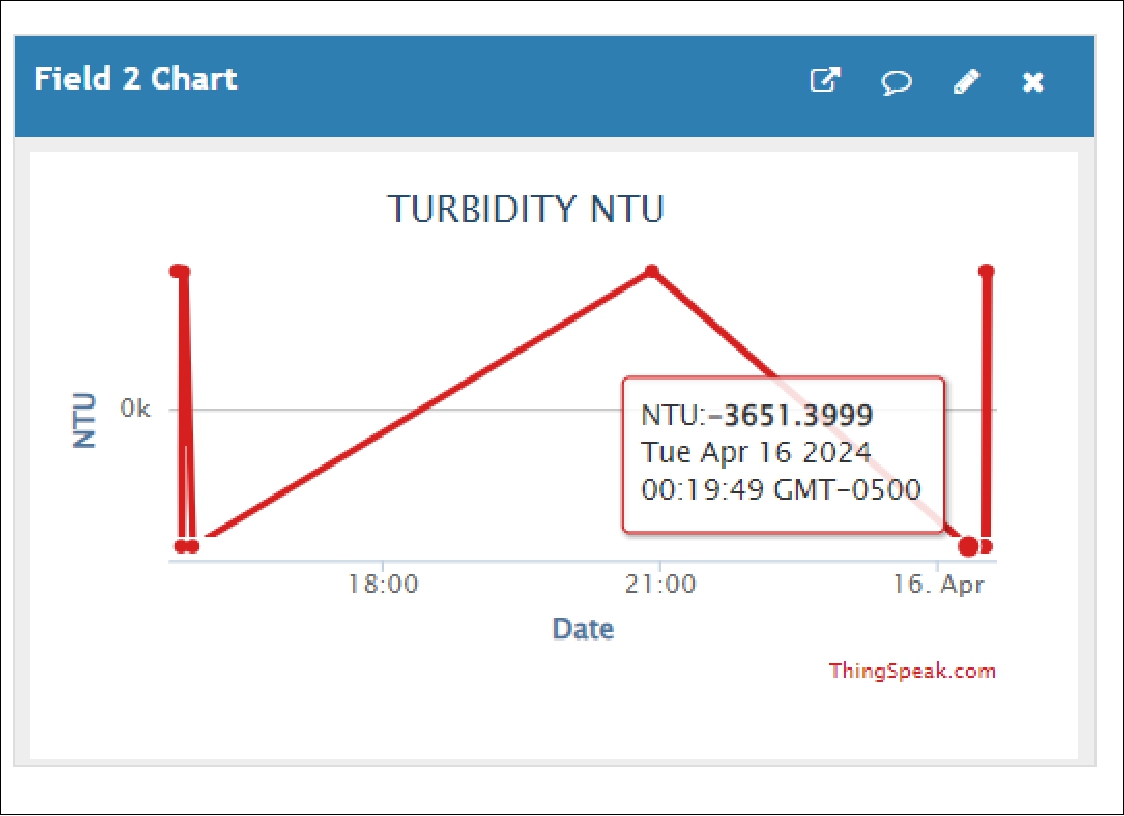
Now that we have established data collection in the cloud on a regular basis, we have the advantage of being able to access it at any time. This functionality gives us the ability to export the data according to our needs, allowing us to perform deeper analyzes or share the information conveniently when necessary.
This week was a lot of learning as it allowed me to explore the turbidity sensor. Interpreting the voltage data was critical to understanding water quality: higher values indicate greater clarity. Real-time visualization using the Arduino IDE allowed turbidity changes to be monitored instantly. Experimenting with different elements added to water provided a deeper understanding of how they affect turbidity levels
Development of custom electronic boards with CNC Router.

Development of personalized keychains and ornaments with CNC Laser.
Development of custom machines "Desktop CNC Laser.

Huánuco is a Peruvian city, capital of the district, province and department of the same name in the north-central area of the country. The city has a population of 235,529 inhabitants. .